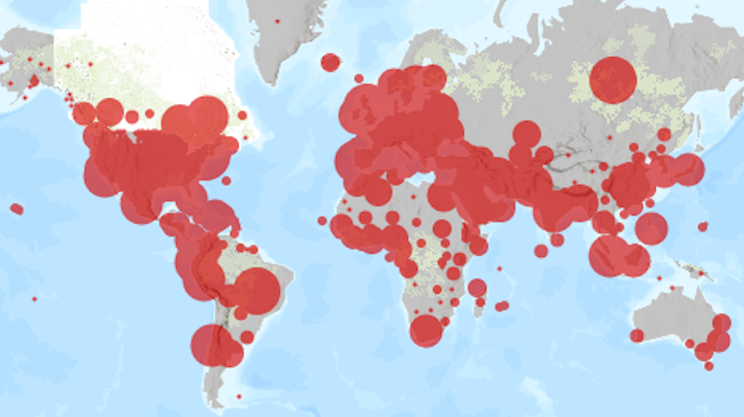
With the numbers getting so high, moving so quickly, tracked at so many levels, you could find a scary new coronavirus statistic every day. Nova Scotia hits 900 cases of C19. The United States reaches 1,000,000 cases. There are 3,000,000 cases around the world.
Actually, those are all from Monday.
The last time we looked at the biggest picture, the total number of reported C19 diagnoses on the planet, was at the 2,000,000-case milestone. That happened April 15. Days before Nova Scotia’s mass shootings reminded us some things are more awful than a deadly virus. Before the worst such attack in recent Canadian history became our reality, an unprecedented nightmare to join the other unprecedented nightmare of C19 in our every waking thought.
Which is to say it feels like forever ago we reached 2,000,000 cases. But the numbers say it happened quickly. Getting from one million cases to two million took 13 days; from two to three took just 12. The disease picked up speed.
Paradoxically, the numbers also say it is slowing down. Oh those zany numbers.
Let’s back up to take in COVID’s whole trajectory, zero to 3,000,000. The first million cases happened over 137 days. The second million needed 13 days, or just about 10 percent of the time for the first million: 10 percent of 137 days = 13.7 days.
At that rate of acceleration, the third million would have arrived in about 1.3 days: 10 percent of 13 days = 1.3. Instead it took 12 days, from April 15 to April 27. Even though the disease is still moving fast, faster than ever, in the deceleration is a sign of optimism that it’s slowing down.
I know what you’re thinking, because I’m thinking it too: Stats are such bullshit. However, if you’ll bear with me enough to look at a graph—a big ask—you’ll be able to say you did some math today.
The following graph from Worldometer shows the number of new cases reported every day around the world. Around the end of March, the cases start coming in distinct weekly waves, going up steadily for a couple days before peaking, then dropping into a trough before building again.
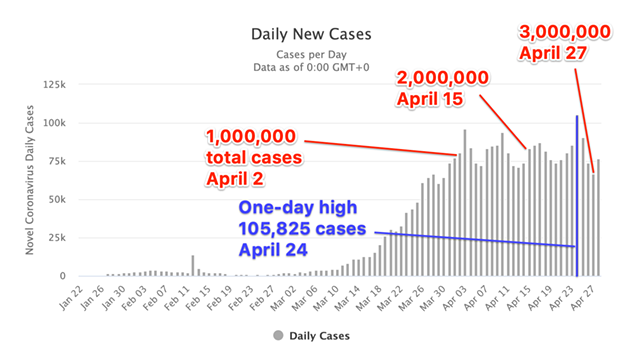
Immediately after 1,000,000 cases comes a major peak, the most daily cases seen to that point. Then the numbers dip before growing to another peak. Those two strong, similar waves drive the numbers to 2,000,000 cases.
Things get less consistent after that. The next wave crests without a peak popping up, then comes a wave with the highest one-day peak ever, followed by a drop to a daily case level we haven’t seen since March. (Coincidentally that’s April 27, the day 3,000,000 cases is reached.)
Shifting metaphorical gears from surfing to sprinting, that record high of April 24 feels like a runner’s last push at the finish line. Or at least it feels that way to a human trying to make sense of inhuman things like statistics and viruses. Three million cases is a significant milestone, however it’s only a milestone, a marker on a path that has no end in sight.
After weeks of lockdown efforts around the world, the number of new cases should be dropping. The curve is supposed to peak and flatten. What we’re doing has to be working. But is it? We’ll have a better sense of that at 4,000,000 cases.