The wrong sized convention centre
The documents I examined are all found on the website Trade Centre Limited has created to argue for the convention centre.
First is a “Phase 1 Report” compiled by Criterion Communications, a Vancouver firm, at the request of TCL. This report, finalized on April 9, 2009, examined the need for a larger convention centre. The president of Criterion Communications is Rod Cameron who, Criterion’s website explains, is the “Executive Director of Convention Centres of Canada and Director, International Development for the Brussels-based International Association of Convention Centres.” He is, in other words, in the business of pimping convention centres. Supporters would no doubt say that bringing in someone with Cameron’s vast knowledge only makes sense; I’ll simply note that there’s an implicit conflict of interest and leave it at that.
Let’s just cut to the conclusion of the Phase 1 Report (page 7):
A preliminary estimate based on the apparent business opportunity and comparisons with other Canadian centres suggests that a facility designed to accommodate 1800- 2,000 delegates and configured to be able to efficiently manage multiple, simultaneous events would be justified. In general terms this would roughly equate to a facility of between 150,000 and 170,000 square feet of rentable function space comprising a combination of exhibition / multi-purpose space and meeting, ballroom and pre-function spaces. This would in turn suggest a minimum overall building size of some 300- 340,000 gross sf, assuming a 50/50 net/gross space ratio which is again typical.So, according to Criterion, what Halifax needs is a convention centre with 150,000-170,000 square feet.
That size centre becomes important in the next study commissioned by TCL, the HLT Advisory Assessment, produced by HLT Advisory, a Toronto firm whose managing director is Lyle Hall. "Prior to forming HLT Advisory in 2005 with Rob Scarpelli, Lyle was the National Director of KPMG Canada's Hospitality, Leisure & Tourism practice, based in Toronto," explains his website. At KPMG, Hall produced the projections for the new Vancouver convention centre, which has famously failed to live up to KPMG projections.
In Halifax, HLT studied the market potential for the larger convention centre and prepared “an order of magnitude revenue and expense estimate” for it. The HLT reported was submitted in May, 2009, and was based on the projected need outlined by Criterion. As noted on page 41 of the HLT report:
While the projections [of the potential increase in the size of events to be held in the larger convention centre] are based on exhibit hall size, a key assumption is that meeting space will also be available within the expanded WTCC so that total meeting space, as identified in the Phase 1 report in the order of 1:1, with an appropriate array of break out rooms.In other words, all the projections in the HLT report are based on a convention centre of between 150,000 and 170,000 square feet called for in the Criterion report. And, in turn those projections are brought forward into four subsequent reports, which we’ll get to soon. But the actual proposal for a convention centre---the proposal we have before us now---has just 120,000 square feet.
[emphasis added]
So, all the studies are looking at the potential increase in business, the potential increase in delegates travelling to Halifax and the potential economic and tax benefits of a convention centre that’s from 25 to 42 percent larger than the convention centre we’ll actually end up with, should it get built.
Clearly, a larger convention centre is going to be able to hold bigger conventions and more delegates than a smaller one, and more delegates coming to Nova Scotia should mean more "spinoff activity" in the economy. But none of the reports examining the supposed benefits ever mention that they’re basing their conclusions on a convention centre that’s much larger than the one we’re talking about.
We’re being told about all the supposed benefits of a golden convention centre, but they’re only giving us an aluminum convention centre. It’s classic bait-and-switch.
But wait: it gets worse.
Ballooning delegate numbers
Based on that larger 150,000-170,000 square foot convention centre that is not in the proposal endorsed by premier Darrell Dexter, HLT made some pretty specific projections about how many conventions the new convention centre would attract, and how many delegates would attend those conventions. HLT summarized those projections in a table on page 42:

Therefore, the real total delegate figures are found by multiplying the number of events by the average delegate figures in the subtotal and total lines, with these results:
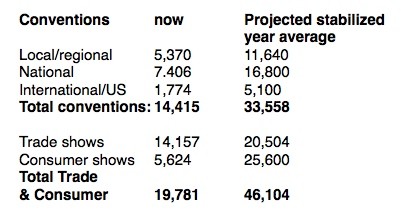
The projections [in the table] reflect a stabilized operating year. Other Canadian convention centres have experienced a “honeymoon” period after opening as pent up demand and anticipation of a new facility combine to create greater interest. Therefore for modelling purposes the stabilized year for convention activity should be viewed “Year 4,” with Years 1, 2 and 3 generating 85%, 115% and 110% of Year 4 activity.So, according to HLT, once the new convention centre is open, there will be an initial big burst of conventions which will settle down in the fourth year of business. Beyond that, HLT makes no comment---Year 4 is the “stabilized year,” and HLT makes no predictions of future increases in business beyond Year 4.Trade and consumer show event load projections for the stabilized year are applicable for Years 1 through 3.
But the next document tells a different story.
The province and HRM jointly commissioned Deloitte, a New York-headquartered firm, to look at the business case for the proposed convention centre. Deloitte delivered the report July 12, 2009.
Deloitte also came up with some delegate projections, and while nowhere in the report does it state exact figures, there is this chart on page 21:
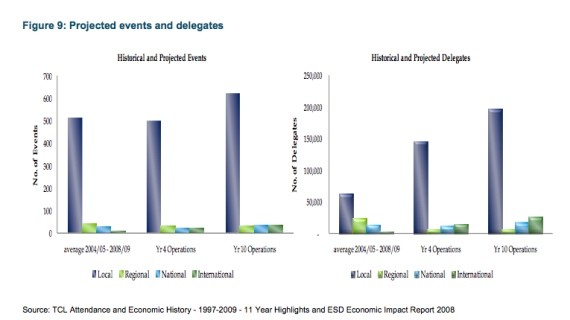
The data used by the ESD, was based on total events and attendance from the 2006 study reallocated into categories on the basis of the 2002/03 to 2006/07 WTCC actual historical figures for events and for delegates. This is the data that underlies the economic impact analysis. The projections are provided for year 4 and year 10 of the proposed expanded convention center. Year 4 of the operating period represents a “stabilizing” year. This is due to the fact that other Canadian convention centers have experienced a “honeymoon” period after opening as pent up demand and anticipation of a new facility combine to create greater than normal expectations. It is expected that years 1, 2, and 3 would generate approximately 85%, 115%, and 110% of year 4 event activities respectively. Year 10 was the last year of the pro forma by the ESD.So, for past history they used numbers provided by Trade Centre Limited. For the Year 4 figures they took numbers (and used the exact text) of the HLT report. For the Year 10 figures they used “the pro forma” created in-house by the Economics and Statistics Division of the department of Transportation and Infrastructure Renewal. That is---the Year 10 projections, which look to be about 25 percent higher than the Year 4 projections---are not based on any market analysis or business case, but rather created out of whole cloth, apparently just for the sake of adding an inflator.
But that imaginative Deloitte projection is carried forward into the next document, an economic impact study of the proposed convention centre, conducted by Gardner Pinfold, a Halifax firm, and delivered in December 2009.
The economic impact projections of the proposed convention centre boils down to this question: if this number of delegates came to Nova Scotia and each delegate spent this amount of money, what would be the impact on the provincial economy? It was not up to Gardner Pinfold to determine the number of delegates or the money spent per delegate---those figures came from the previous studies.
The first Gardner Pinfold analysis (as we’ll see, there is a second) pulls a lot of information straight out of the Deloitte report, going so far as to plagiarize part of the introduction, word for word, without attribution (compare the second paragraph on page 12 here with the second paragraph on page 1 here). That heavy borrowing is carried over to the delegate projections. As explained on page 14:
The projections for attendance presented by Deloitte are the foundation for delegate impact analysis. Deloitte indicated that other Canadian convention centres were reporting delegate attendance in the first three years that was 85%, 115%, and 110% of the stabilized year levels. They provided stabilized year four estimates for the proposed WTCC in Halifax as well as year ten estimates. Based on this information, the following figure shows the combined delegate attendance for each of the origins that is expected over the first ten years after opening. The estimates for years 5 to 9 assume straight-line trends between the stabilizing year and year ten of operations.And it is illustrated by this chart:

Before we get to those economic impact projections, let’s pause for a moment and consider what’s happened so far. Criterion issued a report saying there should be a 150,000-170,000 square foot convention centre. Then HLT said that that-sized convention centre would accommodate a certain number of conventions and delegates, a figure that would stabilize in four years. Next, Deloitte took an arbitrary inflator supplied by the Economics and Statistics Division and came up with a higher number of delegates for 10 years out. The next step was for Gardner Pinfold to use the Deloitte numbers to calculate the economic impact---that is, the economic impact from arbitrarily inflated delegate numbers attending a convention centre 25 percent larger than the one proposed.
Gardner Pinfold addresses the size issue on page 2:
The WTCC II will be a world-class facility that contributes to the sustainable future of downtown Halifax and creates a contemporary public space unique to the region. The detail set out below is illustrative. The final configuration will be set through the formal request for proposal process. The impact analysis in this report flows from this illustrated information. Actual impacts associated with the facility will correspond to what is actually built. [...] The net usage space would be about 150,000 sq. ft....There is a chain of delusion through the reports, with a bad assumption (the wrong sized convention centre) getting incorporated into calculations that are fudged, then fudged again. But what happens next is even more remarkable.
Trade Centre Limited’s fictional delegate count
Six months after Gardner Pinfold’s first economic impact analysis was submitted, Trade Centre Limited created its own report “Market Projections For A Proposed New Convention Centre,” completed in June 2010. This document forecast wildly increased delegate numbers---far larger than the numbers predicted in the consultant reports. Then, TCL gave the new numbers back to Gardner Pinfold to recalculate the economic impact based on “updated delegate projections.”
To say TCL’s projections are improbable is an understatement. More disconcerting, some of TCL’s projections are grouped in categories that are incompatible with categories used in the consultants’ reports, so it’s impossible to compare the two side by side. But even where the categories agree, the numbers don’t.
Let’s compare TCL’s base year event figures with those of HLT, above:
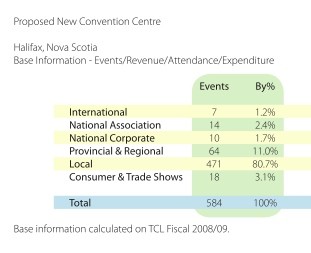
The TCL delegate projections are found on page 21:
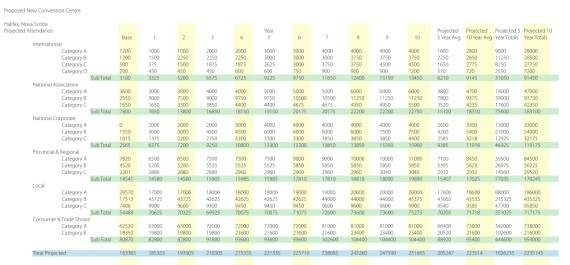
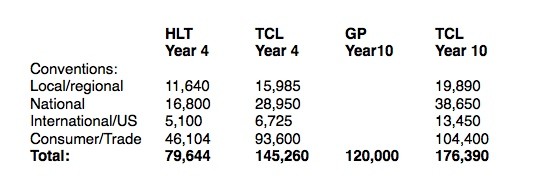
But when TCL made a projection for Year 4 in a 120,000 square foot convention centre, it came up with a projected delegate figure that is 82 percent higher---nearly double---than that forecast by HLT.
TCL’s Year 10 projections are even more outrageous. Eyeballing the Gardner Pinfold chart that includes the arbitrary Deloitte inflator to Year 10, we see a Year 10 figure of somewhere around 120,000 delegates (the total 250,000 minus the excluded 130,000 “local event” delegates); TCL’s Year 10 number, however, is 176,390--- about 46,000 greater than Gardner Pinfold’s figure, and 120 percent greater than HLT’s “stabilized year” figure---two-and-a-quarter times as much.
Nowhere in the document does TCL note these discrepancies, nor does TCL give any explanation for how its numbers were created.
Recalculating the economic impact
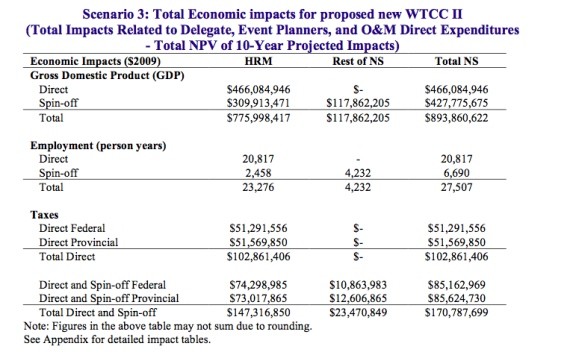
Having produced its greatly inflated numbers in June 2010, TCL gave them to Gardner Pinfold to run a second economic impact analysis, which was completed the next month, in July 2010.
Reading the second Gardner Pinfold report, you can almost hear the pain in the voice of the author as he or she dances around the elephant in the room---that they’ve been handed a bunch of inflated numbers that aren’t supported by any evidence: “This study extends the assessment of economic impacts attributable to WTCC II conducted in the previous study by including the economic impacts resulting from direct expenditures of updated delegate projections, event planners, consumer and tradeshows and smaller local events remaining in the local economy...The economic impact analysis in this report is based on the estimated number of events and subsequent direct expenditures attributable to delegates, planners, and O&M projected over the 10-year period, as reported in the Trade Centre Limited (TCL) report, Market Projections for a Proposed New Convention Centre: 10-Year Projections By Market Segment, 2010.”
The differences between the first and second Gardner Pinfold reports are profound, and I will look at them in more detail in Part 5 of this series. For now, though, I merely want to give an idea what TCL accomplished by creating its own inflated delegate numbers.
Gardner Pinfold was in an unenviable position, having to rework numbers it had already compiled. The company never lies---so far as I can see, its calculations are reasonable, given the assumptions it had to work with. And never mind that those assumptions changed because of the new TCL delegate numbers---Gardner Pinfold never assesses whether the changed assumptions are warranted.
Still, for whatever reason, the two Gardner Pinfold reports aren’t directly comparable---the firm never says “here’s what the first economic impact report said and here’s what the same numbers are now that we used the new delegate counts.” But if we dig through the two reports we can find two charts that give an indication of the effect of the new TCL numbers.
From the Gardner Pinfold’s first economic impact report comes this synopsis (page 22):

Let's recap: We had four consulting firms doing an analysis on the need for and potential economic impact of a proposed convention centre, basing all their projections on a 150,000 square foot convention centre, as opposed to the 120,000 square foot convention centre that's proposed. Along the way, the firms added in an arbitrary inflator that made the future delegate count much higher than was justified, and then that figure was used by Gardner Pinfold to forecast the economic impact of the convention centre. But Trade Centre Limited evidently wasn't happy with even those inflated results, and so did their own in-house delegate projection that was more than double that projected by the consultants; those higher figures were then given back to Gardner Pinfold to run a second economic impact analysis that showed a supposed economic impact two-and-a-half times the first.
And convention centre supporters expect us to take all this seriously.